TEAM CHARTING TOOL
Team Charts allow you to plot a group of people on one chart to get an at-a-glance view of their personality styles. You can also click on individual plotting points on the graph to view summary information on each person. Summary charts are also available for each group member.
Select your preferred chart options, then enter your list of ACCESS CODES below and click on the "View Team Chart" button. Access Codes are case-sensitive.
Step One
Chart Options
Step Two
Enter List of ACCESS CODES
Guide to Reading Team Charts - Group Patterns:
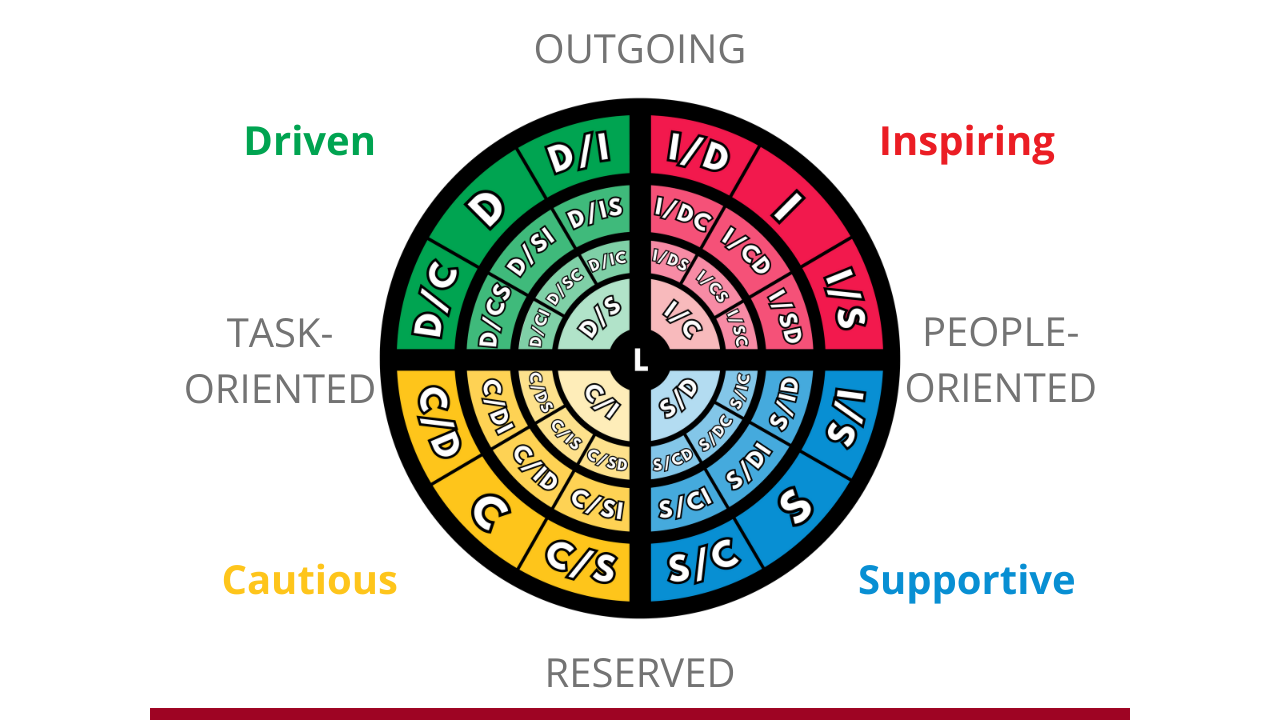
When you chart a team of people, you can look for patterns that will emerge. Consider the DISC Model of Human Behavior shown below as you look at the chart. Keep in mind the characteristics of Outgoing vs. Reserved and Task-Oriented vs. People-Oriented.
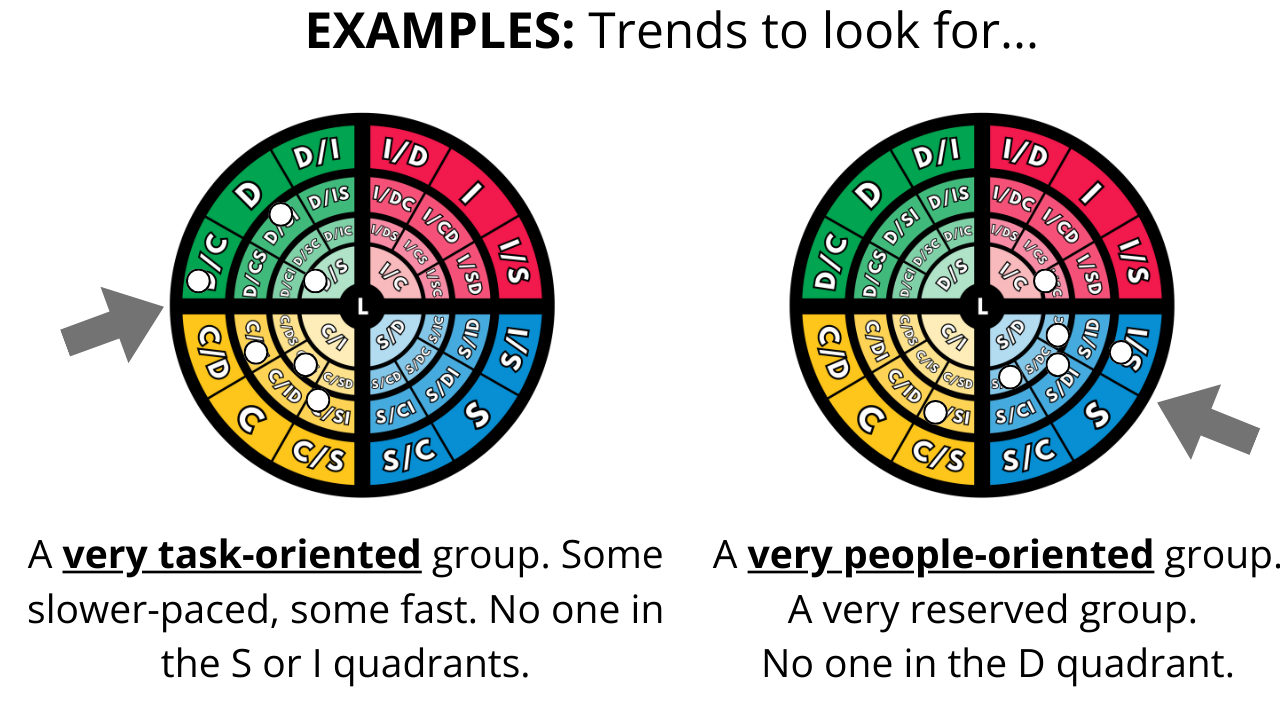
Look for group patterns. Also look at each person on the team.
Tips on using the combined team graph:
1. Consider this: The results of the personality assessments can be further explored for each person by clicking on their plotting point on the graph.
2. Be aware that charts with a large number of codes (50+) may occasionally not work properly if the server is overloaded. If you have trouble, you may need to try again later. If you experience technical difficulty, then please contact our support team: [email protected]
3. Again, keep in mind the major divisions of the chart ... Outgoing vs. Reserved and Task-oriented vs. People-oriented. Look for whether the group is weighted toward one side or the other. That can indicate the flavor of the organization.
4. Keep in mind that everyone is a blend of all 4 personality styles. This graph is not meant to "pin" anyone down. The graph is intended to be one view of the group. Use this as a tool - as a way to envision an organizational snapshot.
5. The team graph page allows you to save it as a PDF, or alternatively, scroll to the bottom of the page to see an option to save the team graph as a high-resolution (poster size) version. This option exists for those who want to have a poster sized visual version printed of their unique team graph.

Ready to get DISC Certified?
You've come to the right place. Chris and Melissa are Executive Master Trainers in the DISC Model of Human Behavior who certify Consultants exclusively in association with Personality Insights. Experience the difference being trained with the best, by the best, makes!
There are three things to consider when determining who you want to get certified with:
1. The training process
2. The curriculum
3. The assessments
Want to learn more about all three of these and what makes Personality Insights certification stand head and shoulders above the rest?
Learn More About Our Virtual & In-Person ClassesCopyright 2026 Personality Service
The team charting tool on this page is exclusively used by permission with our partners at Personality Insights.